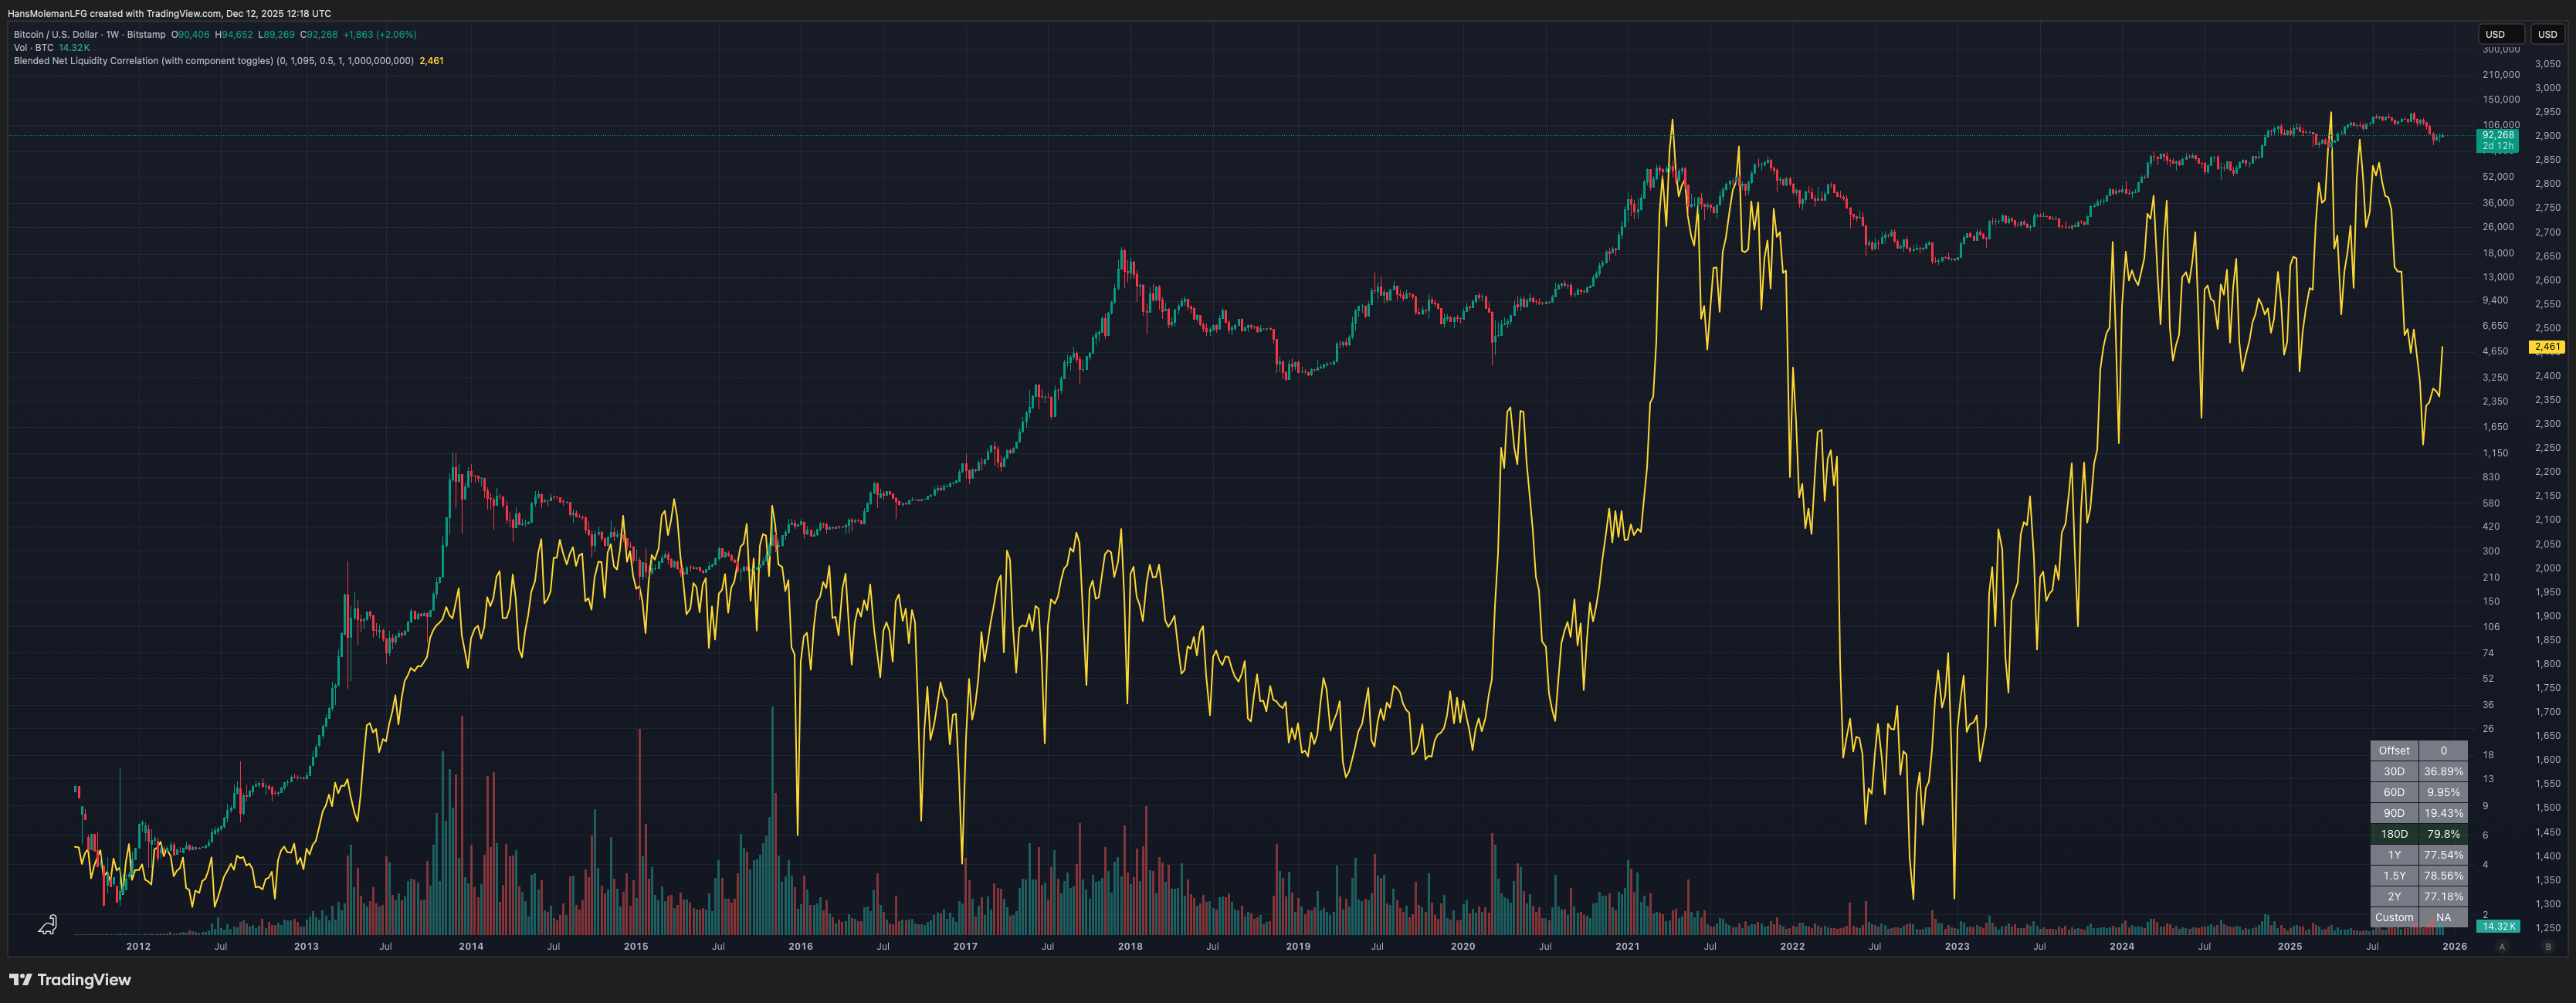
Blended Net Liquidity Correlation
Many traders use liquidity-based models to understand broad macro conditions and their potential influence on price. While institutional-grade models often rely on proprietary inputs, the community frequently studies public FRED series—such as WALCL, RRP, TGA, and BTFP—to construct transparent net-liquidity frameworks that approximate capital movement within the financial system.
This script does not replicate or reverse-engineer any commercial macro indicator. Instead, it provides a flexible, transparent structure for exploring how different liquidity components interact — and how those liquidity dynamics correlate with market price across various time windows. The indicator is free to use on TradingView; the script is protected.
Click the chart to open the indicator on TradingView.
How Traders Recreate This Without the Indicator
You can approximate similar liquidity views manually in TradingView using public series and symbol math. The platform lets you add/subtract series directly, then smooth and compare against price.
- Combine public series using symbol math (example style: WALCL − RRP − TGA).
- Apply smoothing (like an SMA) to reduce noise.
- Compare the result against price and test different offsets/timeframes.
- Build multiple variants (with or without balance sheet data) and compare behavior.
This indicator packages those steps into a cleaner workflow with component toggles, blending controls, smoothing options, and multi-window correlation analysis.
What the Script Does
1. Builds a customizable blended net-liquidity model
- Includes components such as WALCL, RRP, TGA, BTFP, ΔTOTLL, and ΔM2 (depending on script settings).
- Allows toggling each component on/off.
- Provides adjustable blending/weighting for balance-sheet vs short-term flow models.
- Supports optional SMA smoothing to reduce noise.
- Supports offsetting liquidity to study potential lead/lag relationships.
2. Runs multi-period price correlations
- Computes correlation between liquidity and price across multiple windows.
- Includes short-term and long-term horizons (e.g., months to years).
- Displays results in a compact table.
- Automatically highlights the strongest correlation window.
3. Plots liquidity alongside price
- Plots the blended liquidity series directly on the chart for visual comparison.
- Designed to provide macro context, not signals.
- Helps frame liquidity regimes relative to market structure.
4. Maintains transparency and reproducibility
- All inputs are public data series; no proprietary feeds required.
- No hidden weighting or undisclosed logic.
- Designed for research and hypothesis testing rather than prediction.
Why This Script Is Useful
Traditional liquidity charts often plot only one variable at a time. This framework adds clarity by combining components into a unified model and allowing you to test which inputs matter most.
- Combines multiple macro liquidity components into a single blended series.
- Gives full control over which components are included.
- Provides smoothing and offset tools for cleaner research.
- Offers multi-window correlation to quantify relationships instead of relying on narrative.
- Helps study whether liquidity tends to lead, lag, or coincide with price on your chosen asset.
This tool is most useful for macro-focused traders, swing traders, crypto/macro analysts, and anyone studying how systemic liquidity interacts with price.
What This Script Is Not
- Not a recreation of any commercial macro model.
- Not a predictive tool or a “signal service.”
- Not financial advice.
- Correlation is descriptive — it does not guarantee future performance.
How to Use
- Select which liquidity components to include.
- Adjust any blending/weighting settings to emphasize balance-sheet vs flow dynamics.
- Apply smoothing if you want cleaner trend structure.
- Optionally offset liquidity to test lead/lag hypotheses.
- Use correlation windows to see where relationships have historically been strongest.
- Combine with structure, trend, and volume for macro context — not signals.
Important Notes
- FRED data updates weekly and may revise historical values.
- Correlation does not imply causation — it measures relationship, not predictiveness.
- Liquidity models are approximations, not definitive macro forecasts.
- Always validate settings across multiple assets and timeframes.
Not signals. Not alerts. Not shortcuts.
The goal is to document how indicators work — not to tell anyone when to trade.
If an indicator can’t be explained down to its underlying mechanics, it probably isn’t understood well enough to trade.
Disclaimer
This tool is provided for educational and analytical purposes only. It does not constitute financial advice or a recommendation to trade. Always validate settings, test on multiple assets and timeframes, and use proper risk management before trading live.